AI/ML Engineering Finance & Business
The Complete Guide to Cloud and AI Cost Attribution

Published date: 17/06/2026

Most SaaS companies cannot explain why one enterprise customer costs 20x more to serve than another.
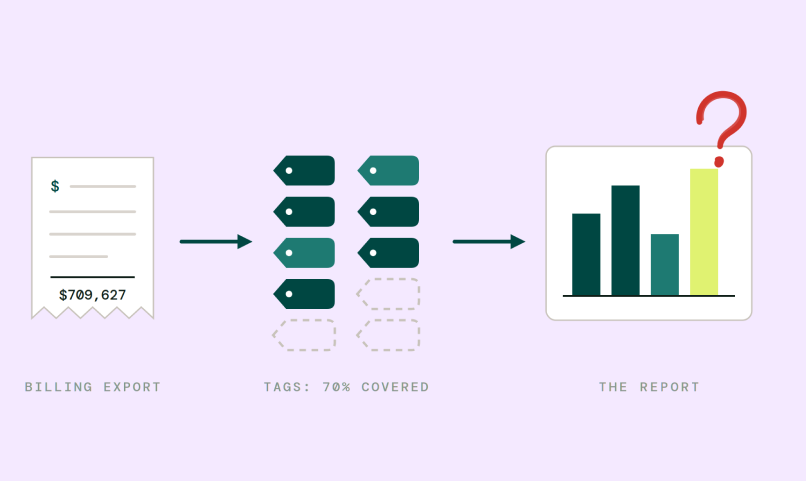
The data exists. It is spread across a Kubernetes cluster, three shared databases, a message queue, an external AI API, and a NAT gateway with no ownership attached. By the time the billing export arrives, the cost has happened. The context that explains it is gone.
This is not a dashboard problem. It is a data problem. Most tools are solving it with the wrong dataset.
| Situation | Billing Export Enough? |
| Simple single-tenant infrastructure | Yes |
| Small team, one cloud account | Yes |
| Kubernetes microservices | Usually no |
| Multi-tenant SaaS product | No |
| Shared RDS, Kafka, or Elasticsearch | No |
| AI inference allocation by customer or feature | No |
| Customer margin analysis | No |
| Self-managed infrastructure (EC2-hosted data systems) | No |
| NAT gateway and data transfer attribution | No |
If your environment maps to the bottom half of that table, billing exports are a starting point. They are not a cost optimization tool. For teams running AI features, this gap is especially acute: token spend is only part of the AI cost surface. Vector databases, orchestration layers, egress, and self-managed infrastructure around the model call routinely represent 40 to 60 percent of total feature spend. Tools that read only the token bill miss most of it.
Cloud billing was designed for a static model: provision a resource, tag it, read the tag at month end.
Kubernetes broke every assumption that model depends on. Pods are ephemeral. Services share infrastructure across team and tenant boundaries. A single customer request spans multiple services before a response is sent. The result: no tag captures who consumed what, only who owns the resource. And ownership is not consumption.
Most Kubernetes cost monitoring tools respond by measuring at the cluster level, CPU allocation, memory requests, pod hours. That is useful context. It is not cost attribution. RDS, Kafka, Snowflake, and data transfer are often a significant and under-attributed cost driver alongside the cluster. Tools that stop at the node and pod level leave most of the bill unattributed.
Four failures follow predictably:
Runtime attribution starts from a different data source entirely: what is actually happening in the system right now.
Attribute deploys an eBPF sensor on compute infrastructure, EKS nodes, ECS tasks, EC2 instances, auto scaling groups. eBPF (extended Berkeley Packet Filter) is a Linux kernel technology that enables safe, sandboxed observation of system activity at the kernel level. The sensor inspects network packets read-only, with no performance overhead and no changes to application code.
What the sensor observes:
From these observations, Attribute builds a live service dependency graph. It knows which services depend on which resources, at what intensity, in what proportions. That graph is the attribution model.
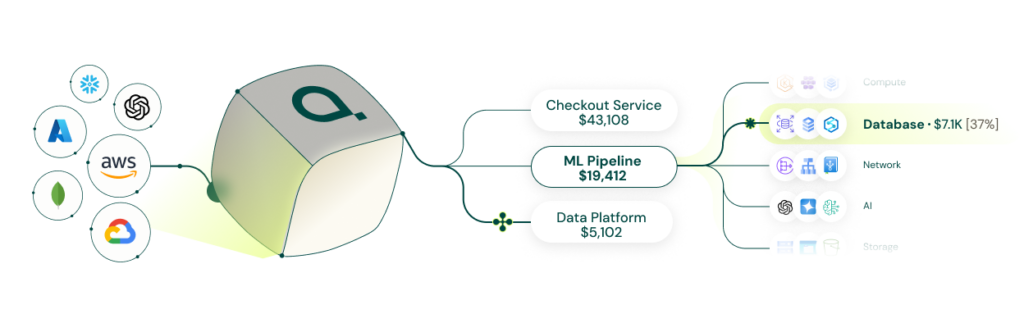
When a shared RDS instance incurs costs, the model does not apply a static rule. It looks at the actual distribution of database queries across services during that period and allocates cost proportionally to real consumption.
New services are discovered automatically when they appear. Relationships update as deployments change. No static service catalog. No manual reconfiguration.
The situation: Island is building the enterprise browser category at a $5B valuation, scaling to hundreds of enterprise customers. Their AWS environment uses shared EKS, RDS, DynamoDB, and significant AZ-to-AZ data transfer. Tagging was not an option, you cannot tag a customer in a multi-tenant architecture.
Before: No visibility into true cost per customer or cost per feature. No ability to support pricing, growth modeling, or GTM decisions with real cost data. Native cloud tools and third-party platforms could show bills and charts. They could not answer what each customer actually cost.
After: Attribute delivered accurate cost per customer and per feature within days. No tagging, no instrumentation, no engineering requests.
Operational change: Engineering, product, and GTM now operate from a shared cost source. Pricing and growth modeling decisions are based on real consumption data, not estimates.
“You can’t tag a customer in a multi-tenant environment. Attribute finally shows us what each customer costs and what’s driving those costs.”,
– Omri Cohen, Director of Engineering Platform, Island
Want to read more?: Click here to read how a leading Work Management platform discovered 360 unprofitable account, or here to read how a security company defragmented reporting for Finance and Engineering departments.
Unit economics require a cost model that maps to the actual unit. For a SaaS company, the unit is usually the customer.
That question cannot be answered from billing exports. Billing shows resource costs. It does not show which customers consumed those resources or in what proportions.
Attribute’s customer attribution layer maps observed runtime activity to customer identifiers, from HTTP headers, workload labels, or naming conventions in database or queue names. Once established, every cost event in the model is attributed to the customer that caused it.
When connected to revenue data, the output is customer-level P&L: which accounts are profitable, which are not, and by how much.
What follows from that visibility:
Time to value: The sensor deploys on Kubernetes via a DaemonSet. Initial workload discovery completes within hours. Meaningful cost attribution is available within days. No tagging project required.
Performance overhead: The eBPF sensor is read-only and sandboxed at the kernel level. It does not intercept or modify traffic. Compute overhead is negligible.
Integrations: Attribute is installed on compute infrastructure (EKS, ECS, EC2) and monitors traffic from the application layer to other cloud resources, including third-party SaaS providers like MongoDB Atlas, Snowflake, OpenAI, and others. No application-level instrumentation required.
Does this replace Kubecost or CloudHealth? For SaaS companies whose cost questions go beyond cluster-level reporting, yes. Attribute goes further on shared resource attribution, customer-level cost-to-serve, self-managed infrastructure coverage, and full AI cost surface visibility, including token attribution by customer, feature, or agent alongside the surrounding infrastructure spend those tools don’t see.
Historical data: Cloud billing history ingests on setup. For teams that need chargeback deliverables before sensor deployment, Attribute can generate reports from customer-supplied billing exports without the sensor.
Supported environments: AWS, GCP, Azure. Kubernetes (EKS, GKE, AKS), ECS, EC2. Snowflake, MongoDB Atlas, OpenAI, Anthropic, Amazon Bedrock, Azure OpenAI, Vertex AI. Self-managed Kafka (including topic-level granularity), Elasticsearch, RabbitMQ.
Security: PII, credentials, secrets, API keys, and cookies are stripped before any data leaves the customer environment. Minimal events transmitted via encrypted OpenTelemetry, JWT-authenticated, TLS-protected. Raw packets are never transmitted. Customers can optionally route telemetry through their own OpenTelemetry endpoint for full audit capability.
Billing-based tools ask what got charged. Runtime attribution asks what actually happened in the system and who caused it.
For buyer teams evaluating platforms, five questions separate tools that can answer the questions that matter from those that can’t:
For teams with meaningful AI spend, add a sixth: can it attribute token costs to a specific customer, feature, or agent, not just an API key? Billing-based tools answer some of those questions partially, for some environments, with significant setup investment. Runtime attribution answers all of them from deployment.
Accuracy depends on how consistently customer identifiers appear in the runtime traffic Attribute observes. For SaaS products built on HTTP-based microservices where customer context travels in request headers, accuracy is high from day one. For workloads where customer identifiers are inconsistent, absent, or encoded in non-standard ways, Attribute works with the team to establish the right extraction pattern before go-live. Attribution is not a binary, the platform shows what percentage of spend is attributed versus unallocated, so teams always know where the model is complete and where gaps remain.
Three patterns create attribution complexity. Ephemeral workloads, batch jobs, scan processes, short-lived compute, spin up and tear down before a sensor connection is established. Attribute handles these with label-based attribution, encoding job identifiers in workload labels rather than relying on live traffic observation. Async queues create a second challenge: a customer action triggers a message that is processed minutes or hours later by a different service with no direct connection to the originating request. The dependency graph handles this by maintaining observed service relationships over time rather than requiring live co-occurrence. The third pattern is workloads that simply do not carry customer context in the request path, shared background jobs or platform-level services that run independently of any customer action. These are attributed proportionally to consuming workloads rather than directly to customers, and are surfaced as a distinct cost category so finance understands what is fully attributed versus modeled.
Nothing changes in application code. The sensor deploys as a DaemonSet on Kubernetes nodes, or as an agent on EC2 instances, and begins observing traffic passively. On the infrastructure side, Attribute requires IAM permissions to pull cloud billing exports, and API access to any third-party services being modeled (Snowflake, MongoDB Atlas, OpenAI, and so on). The full deployment for a mid-size Kubernetes environment typically takes less than a day. Engineering involvement after initial setup is minimal, new services are discovered automatically, and the dependency graph updates as deployments change.
PII, credentials, API keys, secrets, and cookies are stripped at the sensor level before any data leaves the customer environment. Raw packets are never transmitted. What does leave is minimal: purpose-built metadata events describing service relationships, connection volumes, and resource consumption patterns. These are transmitted via encrypted OpenTelemetry protocol, JWT-authenticated, over TLS. For organizations that require full audit capability, Attribute supports routing all telemetry through a customer-controlled OpenTelemetry endpoint before it reaches Attribute’s backend. The sensor operates read-only in a sandboxed kernel environment and cannot modify traffic.
Technical confidence comes quickly. Engineers can validate that the dependency graph reflects the actual architecture within days of deployment, and cost attribution for well-instrumented workloads is visible within the first billing cycle. Finance trust takes longer, typically one to two billing cycles, because finance teams need to reconcile Attribute’s attribution numbers against the cloud bill before they will build workflows or pricing decisions on top of them. That reconciliation is expected and healthy. Attribute surfaces unallocated spend explicitly so the gap between attributed costs and total bill is always visible, which makes the reconciliation process faster. Most teams reach the point where finance treats Attribute’s numbers as the source of truth within sixty to ninety days of deployment.