Cloud Costs, Attributed at Runtime
Most tools read your billing exports. Attribute reads runtime data and maps costs to the workload that spent it.
Everything your team needs to see.
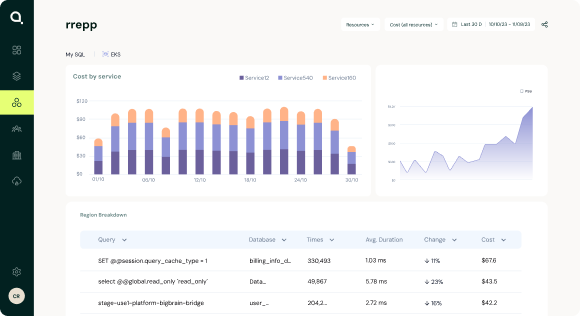
Know which team, customer, or feature is driving your AI spend.
Attribute’s sensor reads directly from LLM API calls, such as Bedrock, Vertex AI, OpenAI, and attributes token consumption to the workload generating it. No manual logging. No prompt wrappers. Just accurate AI cost visibility from day one.
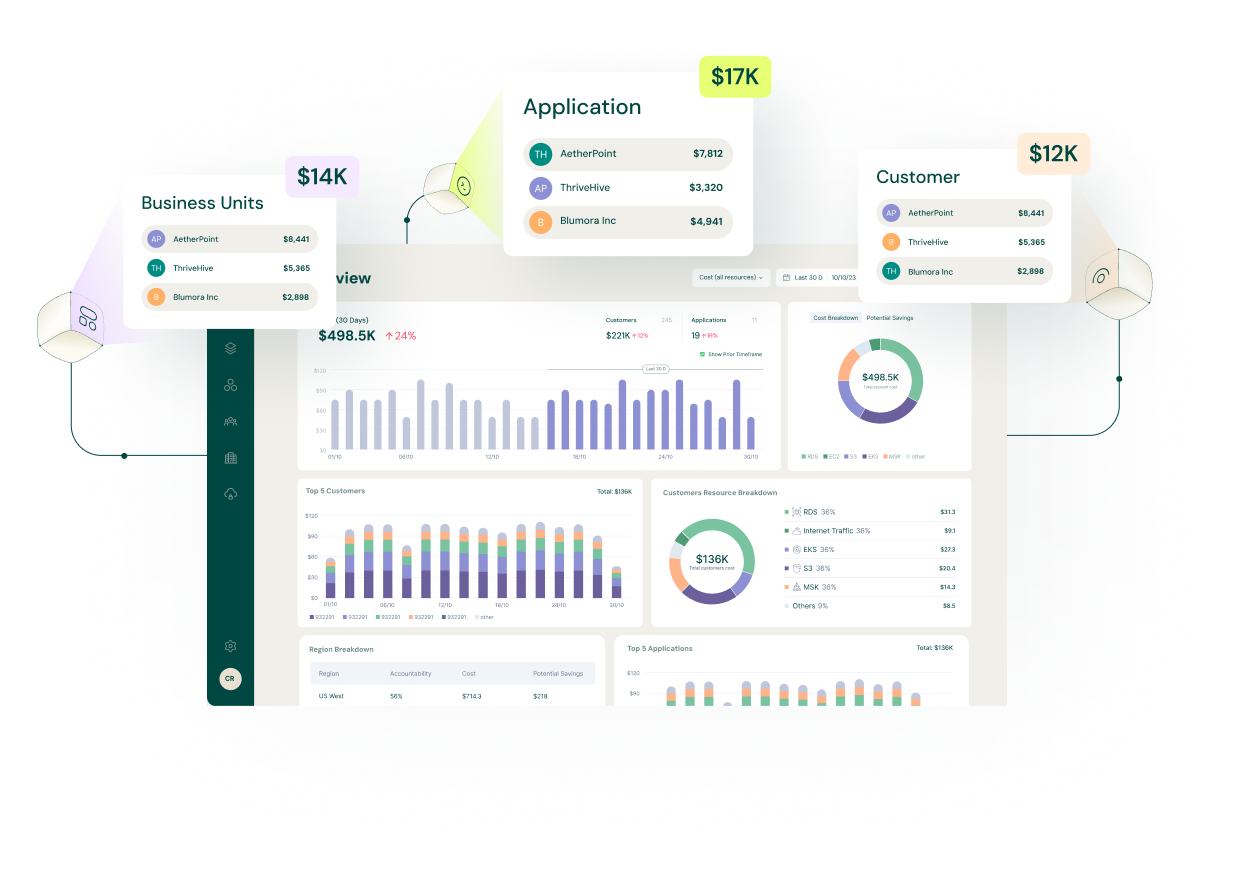
Costs grouped by business context automatically
Attribute correlates cloud usage data from multiple sources, including the eBPF sensor, to group every cloud spend by workload, team, customer, or application. No single resource needs to be tagged.
From cloud bill to profit margin without the manual work
Attribute dramatically shortens the time from raw cloud spend to actionable business insight. Finance and engineering teams see the same data, in business terms, without spreadsheets or manual cost modeling.
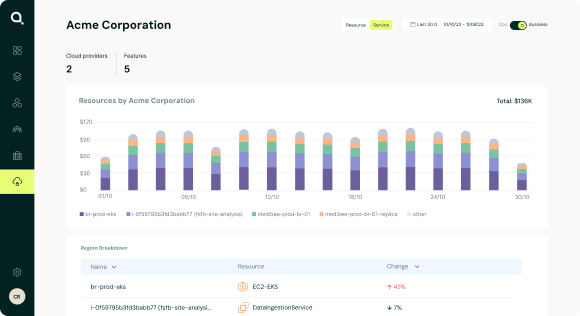
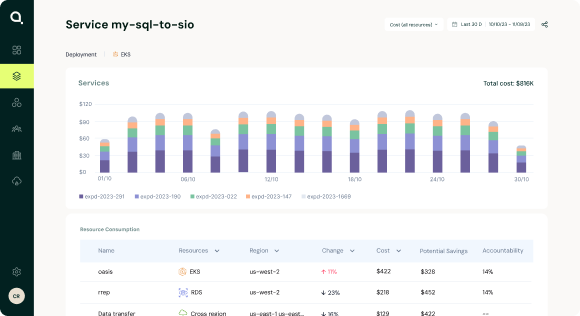
Granular enough for engineering. Clear enough for finance.
Detailed visibility into every query, data transfer, and object consumed, revealing the exact causes behind changes in your cloud bill. Engineers get the specificity they need. Finance gets the context.
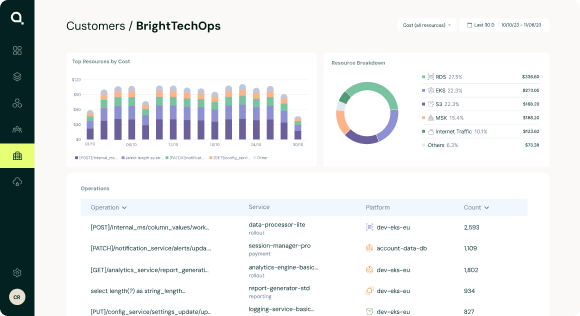
Kafka, Elasticsearch, RabbitMQ, finally visible.
Self-managed infrastructure running on EC2 is a black box to every other FinOps tool. Attribute’s sensor sees inside these workloads and allocates shared costs based on what actually happened, not even splits or rough estimates.
Traditional tools read old data. We read your live system.
Here’s what changes when you stop relying on billing exports and start reading runtime.
How it works
Attribute replaces months-long tagging programs with a lightweight runtime sensor
A lightweight eBPF sensor deploys to your cluster. Immediate time to value with no code or configuration changes
Automatic cost allocation based on runtime consumption
Every dollar attributed to the customer, team, feature, or AI agent that drove it.