Engineering
6 Best Cost Observability Tools for Engineers in 2026

Published date: 07/07/2026

If you’re running cloud infrastructure for a multi-tenant SaaS product, you already know the pain of answering “how much does this customer cost us?”. Attribute delivers cost observability that connects your cloud spend to business metrics, without requiring tags, using actual runtime data.
This guide covers the six cost observability tools built for engineering teams who need cost data.
Engineering-led FinOps requires tools that fit into existing workflows, not ones that demand org-wide tagging migrations or finance-driven abstractions that don’t match how your infrastructure actually works. We evaluated platforms based on how well they serve DevOps, platform engineers, and SRE leads who need accurate cost data without extra overhead.
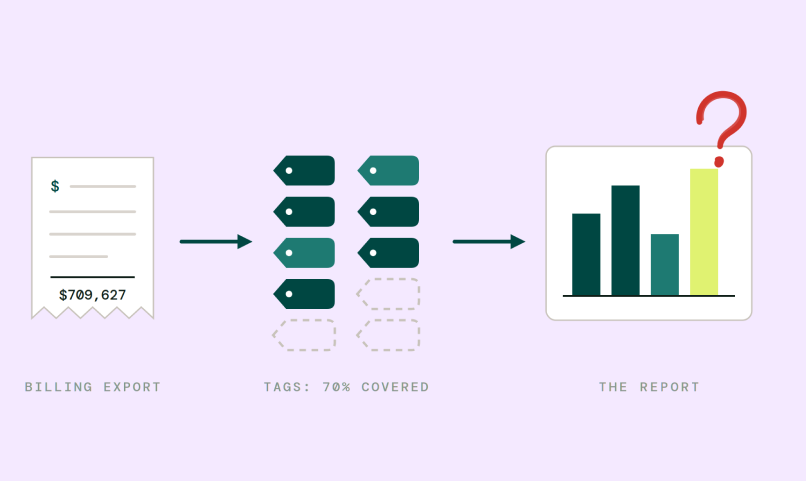
Untagged resource handling: Can you allocate costs for shared resources and infrastructure that lacks proper tags? Most cloud environments have 30-50% of resources untagged, so this matters.
Customer-level allocation: Does the tool break down spend by customer, tenant, or business unit, not just by AWS account or tag?
Multi-tenant SaaS fit: Can it handle shared services, platform teams, and internal abstractions common in multi-tenant architectures?
Observability stack integration: Does it connect with the monitoring tools your team already uses?
Engineering-friendly workflows: Is the data actionable for engineers, or is it designed primarily for finance teams?
Real infrastructure behavior: Does allocation reflect actual resource usage, or just billing labels?
Attribute gives engineering teams something rare in the FinOps space: accurate cost allocation that doesn’t depend on your tagging hygiene. Using proprietary eBPF sensor technology, Attribute captures application-layer data to group costs by the business metrics that matter, customer, service, environment, or feature, all derived from actual infrastructure behavior.
For multi-tenant SaaS companies, this approach solves a fundamental problem. Shared resources get broken down correctly based on real usage patterns, not arbitrary splits or missing labels. You can answer “what does this customer cost us?” without launching a tagging compliance initiative or re-architecting your infrastructure.
Attribute connects cloud spend directly to business outcomes. Platform teams and DevOps leaders can finally show how cloud investments map to revenue, the unit economics visibility that makes pricing decisions and architecture choices defensible.
Pros:
Cons:
CloudZero offers a platform that can organize cloud costs with or without tags using what they call CostFormation. You can ingest spend from AWS, GCP, Azure, Snowflake, and Kubernetes, then organize it by dimensions like cost per customer or feature.
The platform includes AI-powered anomaly detection that automatically defines “normal” spending patterns and alerts your team when costs spike. Their FinOps Account Managers act as an extension of your team, reviewing spend and implementing optimization practices.
Pros:
Cons:
Finout positions itself as a FinOps platform covering all six FinOps Foundation domains, from cost visibility to organizational alignment. The platform includes a native Datadog integration, letting you see spending alongside usage metrics in the same dashboards.
Their Virtual Tag feature lets you organize costs across complex architectures even when tagging is incomplete. Finout also integrates with AWS, GCP, Snowflake, and Kubernetes to bring multi-cloud spending into a single view.
Pros:
Cons:
Vantage provides a multi-cloud cost management platform with support for AWS, Azure, GCP, and various SaaS providers. The platform focuses on cost reporting, budgeting, and optimization recommendations across your cloud footprint.
Their FinOps agent can generate automated recommendations for cost optimization. Vantage also offers team-based views so different groups can see the cost data relevant to their workloads.
Pros:
Cons:
Kubecost is purpose-built for Kubernetes cost visibility, offering real-time monitoring at the namespace, deployment, and container level. The platform reconciles Kubernetes costs with your actual cloud bill for accurate chargeback.
The platform runs as an agent within your clusters, giving you direct visibility into resource requests versus actual usage. Kubecost also includes optimization features like automated pod sizing recommendations.
Pros:
Cons:
IBM Cloudability (part of Apptio) is an enterprise-grade FinOps platform designed for organizations with mature cloud practices. The platform covers cost visibility, allocation, optimization, and governance with features like budgeting workflows and commitment management.
Cloudability includes business mapping tools to allocate costs to teams, products, and business units. Recent enhancements add AI-backed forecasting and expanded support for tracking AI/LLM spending.
Pros:
Cons:
| Platform | Allocation without tags | Customer-level allocation | Multi-tenant SaaS focus |
|---|---|---|---|
| Attribute top pick | Yes — eBPF-based | Yes | Yes |
| CloudZero | Yes — CostFormation | Yes | Partial |
| Finout | Yes — Virtual Tags | Yes | Partial |
| Vantage | No | Tag-dependent | No |
| Kubecost | Label-based | Namespace-level | Partial |
| Cloudability | No | Tag-dependent | No |
Shared resources, load balancers, databases, networking services, are where most cost allocation breaks down. When multiple customers or teams use the same infrastructure, traditional tag-based methods force you to either ignore these costs or split them using arbitrary percentages.
The more accurate approach uses actual consumption data. Attribute captures infrastructure behavior at the application layer, so shared resources get allocated based on real usage patterns. A customer generating 40% of your database queries gets attributed 40% of that database cost, automatically.
This matters because shared costs often represent a significant portion of cloud spend. Organizations need mechanisms that correlate tenant consumption with infrastructure costs, not just tag-based splits that miss the nuance of multi-tenant architectures.
Cost management focuses on reducing cloud spend through optimization recommendations, commitment purchases, and waste elimination. Cost observability is about understanding where your money goes, connecting infrastructure costs to business metrics so you can make informed decisions.
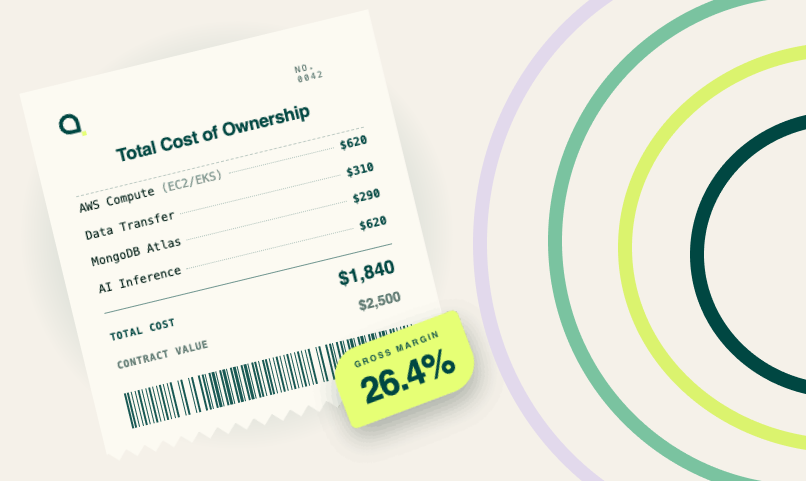
For engineering teams, observability often matters more than raw optimization. Knowing that Feature X costs three times more per customer than Feature Y changes how you prioritize your roadmap. Understanding which customers have negative margins affects pricing conversations. Attribute delivers this visibility by connecting costs to business outcomes, the foundation you need before optimization makes sense.
Many tools focus primarily on finding savings opportunities. That’s valuable, but incomplete without the observability layer that shows you what drives costs in the first place.
Engineering teams face a specific challenge: connecting cloud infrastructure costs to business outcomes without launching massive tagging projects or adopting finance-driven tools that don’t match how infrastructure actually works. Attribute solves this by deriving cost allocation from real infrastructure behavior.
With Attribute, you get customer-level, service-level, and feature-level cost visibility that doesn’t require perfect tags. The platform handles shared resources, multi-tenant workloads, and platform team abstractions, the complexity that trips up traditional FinOps tools.
For DevOps managers, platform engineering leads, and FinOps practitioners building engineering-led cost practices, Attribute delivers unit economics visibility that connects cloud investments to profitability. No tagging hygiene projects. No org-wide migrations. Just accurate cost data derived from how your infrastructure actually operates.
Cost observability means understanding not just what you spend, but why you spend it, broken down by customer, feature, team, or any business dimension. Attribute delivers this by capturing actual infrastructure behavior and grouping costs by the metrics that matter to your business.
Most tools struggle with untagged resources, leaving 30-50% of cloud spend unallocated. Attribute uses eBPF sensors to capture application-layer data, enabling accurate allocation based on real usage patterns rather than requiring perfect tagging hygiene.
Yes, most platforms integrate with cloud providers and observability tools. Attribute focuses on delivering cost visibility that engineering teams can act on, complementing your existing Datadog, Prometheus, or other monitoring setup.
FinOps tools typically cover the full financial operations framework, budgeting, forecasting, optimization, governance. Cost observability platforms like Attribute focus specifically on connecting costs to business metrics, giving you the visibility foundation that makes optimization meaningful.
Customer-level cost allocation requires correlating infrastructure usage with tenant activity. Attribute automates this by capturing real consumption patterns, so you can see cost-per-customer without building custom attribution systems or maintaining perfect tags across shared infrastructure.