Engineering Finance & Business
Producing Reports that Finance Trusts

Published date: 06/07/2026
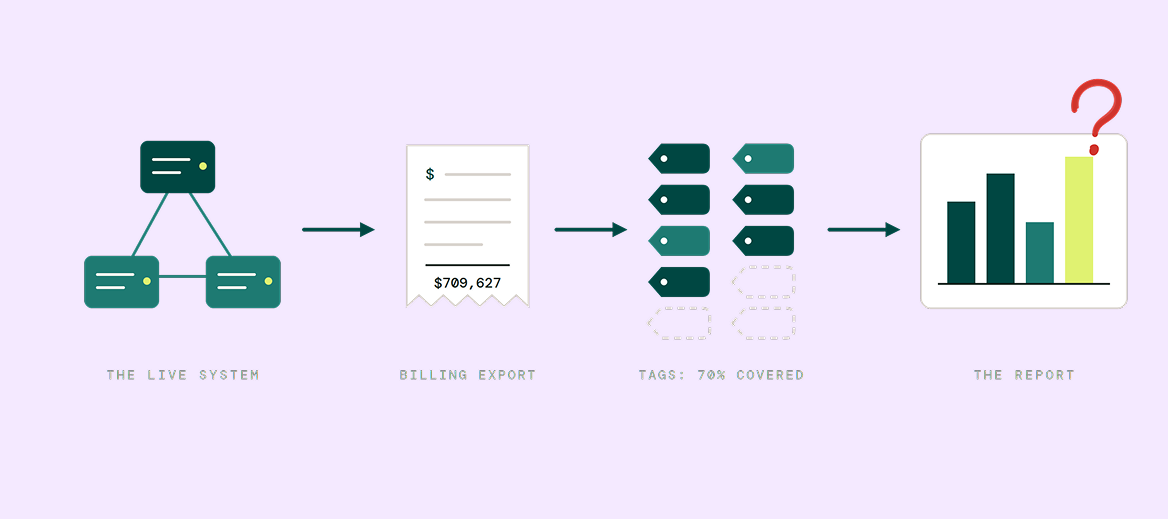
You spent months building reports and dashboards. Cost by team, cost by workload, chargeback by business unit. Everything looks right to the engineers. Finance joins the review and asks “Can you prove these numbers?”
It’s complicated. Your tools break down billing exports, rule engines, and tag coverage that’s 70% complete. That’s not concrete enough for business decisions, forecasts and projections.
FinOps tools were built to read the billing file your cloud provider generates, slice it with rules and tags, and surface the result in a dashboard.
Finance and business leadership ask questions from a different angle. What does it cost to serve Customer X? Which of our products is margin-positive? Most FinOps tools give you an answer. Very few give you an auditable one.
When a stakeholder calls a cost report “trash”, they’re either reacting to numbers that don’t match what they know to be true, or they can’t figure out how the numbers were derived.
In practice, it usually comes down to three things:
Rules once made sense but aged out.
Your allocation rules were set up 18 months ago. Three migrations and two product rebrands later, the rules still point to services and labels that no longer mean what they did. The numbers look consistent in the dashboard because the rules run consistently. Nobody checked whether the rules were still correct. Everyone assumed someone else owned the cleanup.
Tags that never reached full coverage.
Tag-based attribution only covers tagged resources. The 30% that engineering never tagged either get dropped or get distributed via a synthetic split. When finance asks “what’s in the unallocated bucket,” the honest answer is: a significant portion of actual spend. AI inference makes this worse, most teams haven’t figured out how to tag model calls at all, let alone by feature or customer.
Stale data in the model. Old accounts, decommissioned services, contracts that ended, but the historical data is still in the model.
The trust issue compounds when FinOps teams try to answer finance’s actual question: not “what does this workload cost” but “what does this product cost, by region, by customer tier?”
That question requires more than cost data. A customer running three products across five regions doesn’t care which Kubernetes namespace owns the spend. They care whether the customer is profitable. It requires knowing which workload serves which product, which customers consume which workloads, and how shared infrastructure splits across all of the above. Standard FinOps tools can approximate this with enough tagging and rule-writing. But approximations don’t survive a VP asking for the underlying methodology.
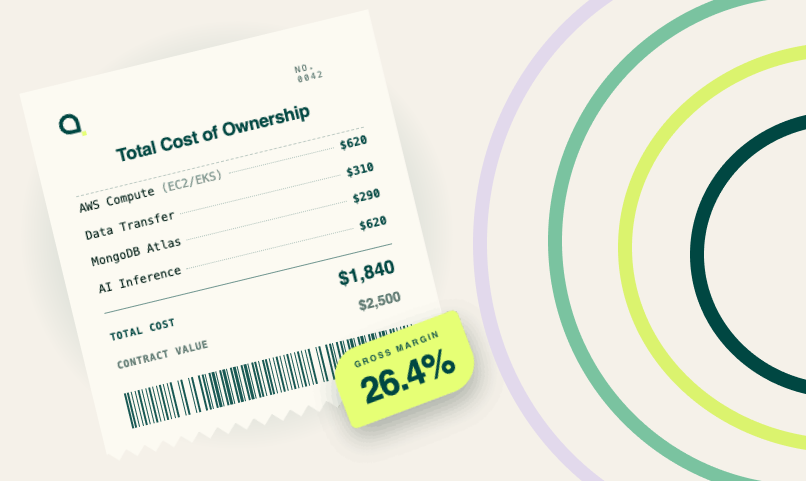
What finance actually wants is cost-to-serve at the customer and product level, including fixed and variable components, including third-party SaaS spend like Snowflake or Twilio, in a format they can defend to the board. Pricing teams need it to set margins. Finance needs it to report COGS. Product leaders need it to know which features are pulling margin down.
Most cloud cost tools are very good at answering “why did our AWS bill go up?” They were never designed to answer “is this product making money?”
The same problem is now arriving faster from AI spend. LLM inference costs don’t behave like EC2. They’re request-driven, per-customer, and they compound quickly. A billing export tells you what Bedrock or OpenAI charged you last month. It doesn’t tell you which product feature drove it, which customer tier consumed it, or whether the unit economics hold at scale. Token volume, model selection, prompt length, none of that maps to a billing line. Finance is starting to ask about AI COGS the same way they ask about cloud COGS. The data gap is identical. The stakes are higher because the costs are moving faster.
Every billing export-based tool has the same structural limitation. The billing file tells you what they charged you. It doesn’t tell you why, which customers drove it, or how shared resources actually split across consumers.
Attribute reads the live system instead of the billing file. An ultra-lightweight eBPF sensor deployed on your compute infrastructure observes which workloads communicate with which databases and services using runtime data, at the network layer. Cost attribution follows actual behavior, not rules about expected behavior.
The difference matters most when a stakeholder asks how you got a number. With billing-based attribution, you trace it back through a chain of rules and assumptions. With runtime attribution, you trace it back to observed network activity.
Take team cost visibility, one of the most common FinOps asks. With a tagging-based tool, you see team cost only as well as your tag coverage and label hygiene. Shared namespaces are a problem. Services engineering deployed last week and didn’t tag yet are invisible.
Attribute’s sensor picks up new workloads automatically, because it observes them communicating in the infrastructure rather than waiting for someone to label them. When your team needs to show “chargeable cost for teams,” the runtime approach produces a number you can defend because it reflects what’s actually running.
The same principle applies at the customer level. If you need to know what it actually costs to serve a specific customer, including fixed infrastructure, variable compute, and SaaS tooling, you can’t get there from a billing export without significant manual mapping. Attribute builds that mapping from what it observes: which customer workloads touch which services, in what volume, at what cost. When customers ask for product cost per region or product profitability within different service types, that question has a real answer rather than an estimate.
The same applies to AI costs. Attribute’s sensor reads calls at the network layer; which service made the call, which customer workload triggered it, what it cost. That’s the number a pricing team can use to decide whether to absorb inference cost or pass it through.
Attribute helps FinOps and finance teams understand what cloud and SaaS spend is actually paying for, using runtime attribution instead of manual tags and billing exports.
Most FinOps tools build reports from billing exports, allocation rules, and tags. Rules age out. Tag coverage is rarely complete. When finance asks how a number was derived, the honest answer traces back to a chain of assumptions, not observed data. That’s the gap.
Runtime attribution means costs follow actual system behavior rather than rules about expected behavior. Attribute deploys an eBPF sensor that observes which workloads communicate with which services at the runtime level. Every cost traces back to observed network activity, not a tagging decision made 18 months ago.
With tagging-based tools, untagged resources either get dropped or distributed via a synthetic split. Attribute’s sensor picks up workloads regardless of whether they’ve been labeled, because it observes them communicating in the infrastructure. New services deployed last week are visible immediately.
Yes. Attribute maps cloud and SaaS spend to individual end-customers by observing which customer workloads touch which services, in what volume, at what cost. That produces true cost-to-serve, including fixed infrastructure, variable compute, and third-party tools like Snowflake or Twilio.
Inference costs don’t appear in billing exports with enough detail to be useful. Attribute’s sensor reads model calls at the network layer, attributing each request to the service, customer, and feature that triggered it. That’s the number pricing teams need to set margins on AI features.
Those tools work from billing exports and require tagging before showing meaningful data. Attribute reads the live system instead. No tagging required, no rule maintenance, and the methodology holds up when a stakeholder asks how you got a number.