AI/ML Finance & Business
How to Track Per-Customer Costs in a Multi-Tenant AWS Architecture

Published date: 22/06/2026
Most SaaS infrastructure is multi-tenant by default. One AWS account, one EKS cluster, one RDS instance, shared across hundreds or thousands of customers. It keeps utilization high, yet makes answering “what does it actually cost to run customer X?” nearly impossible.
This question comes up constantly, and the answers usually range from “we tag what we can and guess the rest” to “we gave up and use average cost per seat.” Neither is good enough if you care about unit economics.
Here’s a practical breakdown of the approaches, their tradeoffs, and where each one breaks down.
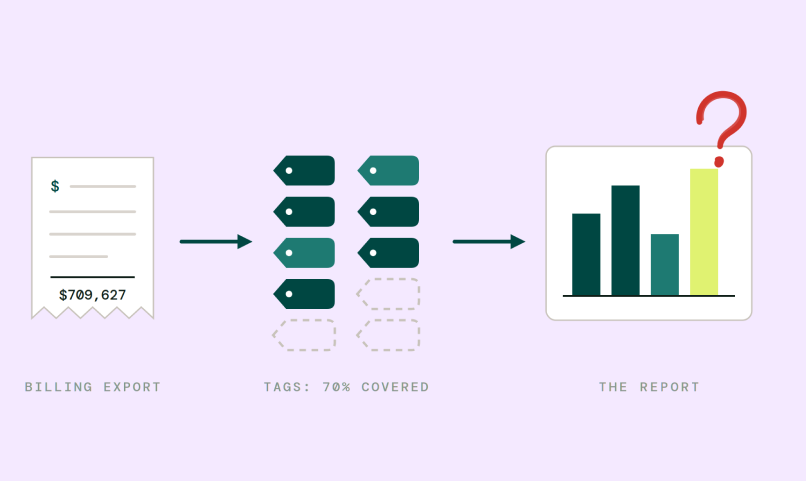
AWS Cost Explorer and every billing-based tool give you cost by account, region, service, and tag. That works fine for dedicated-tenant models, where each customer gets their own account or namespace. It fails for shared infrastructure.
A single RDS cluster serving 400 customers doesn’t have 400 cost line items. It has one. A Kafka cluster serving a dozen product teams still shows up as a single shared cost center. An EKS node pool running mixed workloads is billed as compute, not as “customer A: $142k, customer B: $89k.”
The tagging-based approach breaks here in three ways:
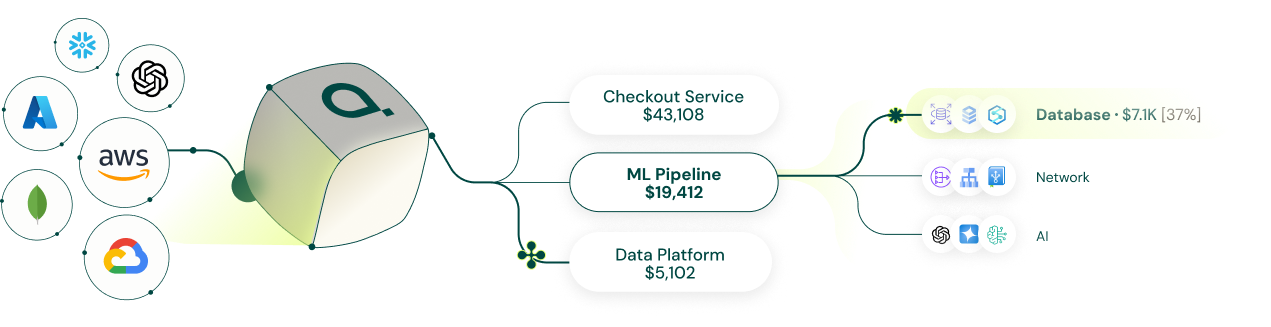
How it works: Instead of reading billing exports or adding application instrumentation, observe what’s actually happening at the network and system level, which services are calling which databases, which customer IDs are present in which queries, how much load each customer generates against each shared resource.
The important distinction is that billing systems only see charges. Runtime systems see consumption.
In practice, this is one of the few approaches that can attribute shared systems like RDS, Kafka, or Elasticsearch back to individual customers without application changes or perfect tagging hygiene.
It also provides real-time attribution instead of delayed CUR exports and can cover self-managed infrastructure that never appears cleanly in AWS billing data.
The tradeoff: This requires a component that observes network traffic and system calls. In the past, collecting this level of runtime data in production was operationally painful. eBPF changed that. The same primitives behind tools like Cilium, Falco, and Pixie can also be used for runtime cost attribution. The difference is that you’re extracting resource consumption signals instead of security or observability events.
How it works: Each customer gets a dedicated AWS account or Kubernetes namespace, with billing isolated accordingly.
Where it works: High-compliance verticals (healthcare, finance), enterprise contracts with contractual isolation requirements, customers large enough that dedicated infrastructure is economically justified.
Where it breaks: It doesn’t scale to hundreds of SMB customers. The operational overhead of managing hundreds of AWS accounts is significant. Reserved Instance coverage becomes fragmented. And you still have shared services (logging pipelines, observability infrastructure, data planes) that sit outside the per-tenant accounts.
How it works: Enforce tagging standards across all resources. Use customer-id, team, service, and environment tags. Pull tagged cost data via Cost Explorer API or AWS Cost and Usage Reports (CUR). Build aggregation logic on top.
Where it works: Greenfield architectures where tagging standards are enforced from day one. Works reasonably well for dedicated compute (EC2, EKS node groups, Lambda) where the mapping between resource and customer is clean.
Where it breaks:
Most teams using it have significant blind spots they know about and accept.
How it works: Instrument your application code to emit per-customer metrics, queries executed, bytes read/written, compute time consumed. Build a cost model that maps those metrics to AWS spend. Multiply metric consumption by unit cost to produce a per-customer cost estimate.
Where it works: Teams with strong observability cultures, applications where resource consumption is dominated by a small number of measurable operations, product pricing teams that need an approximation.
Where it breaks:
It’s a reasonable approximation for internal visibility but doesn’t work for true cost-to-serve analysis.
Per-customer cost attribution in multi-tenant AWS architectures is a solved problem for dedicated-tenant models and an unsolved-by-default problem for shared infrastructure. The standard FinOps toolchain (CUR, Cost Explorer, tagging) gives you cost by service and team. It doesn’t give you the cost by customer.
Getting there requires either moving to a less shared architecture (high ops cost), investing in application-layer instrumentation (incomplete by nature), or observing runtime behavior directly (comprehensive coverage).
If you’re running a consumption-based pricing model or trying to identify unprofitable accounts at scale, the incomplete approaches won’t get you there. If you need a rough allocation for internal reporting, tagging plus some modeling gets you most of the way.
Most teams settle for an allocation model they know is directionally useful but not actually precise.
In general, FinOps tooling is built around cloud bills, not shared runtime behavior. That works until you need deeper attribution inside heavily shared systems.
At that point, the limitation usually isn’t AWS billing data. It’s visibility into how shared infrastructure is actually being consumed.
Attribute focuses specifically on that runtime attribution layer for multi-tenant environments.