Finance & Business
SaaS Hosting Benchmarks by ARR and Maturity


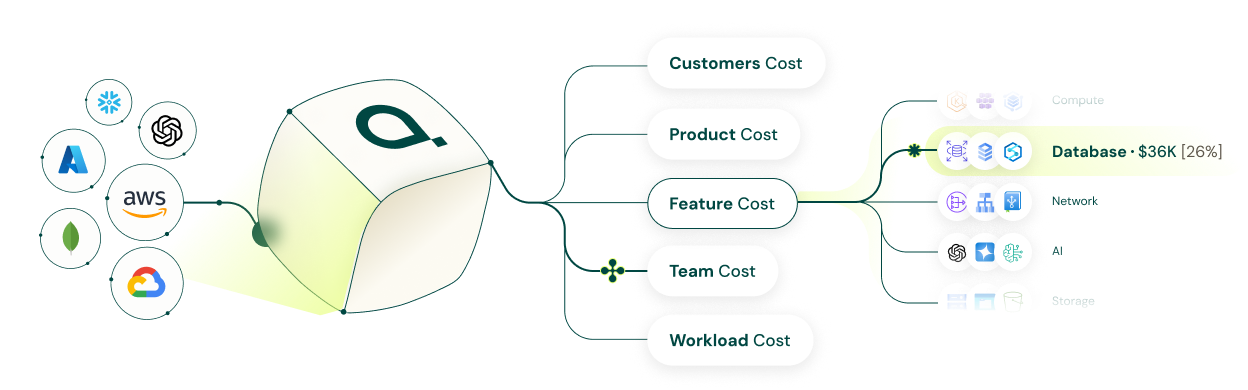
Cloud infrastructure spending is one of the largest and most variable cost centres for SaaS companies. Whether you are running AI-powered analytics or a lightweight B2B platform – how much you spend on AWS, GCP, or Azure can significantly impact your gross margins, valuation, and capital efficiency.
This article presents a benchmark for estimating how hosting expenses evolve with a company’s scale and maturity, backed by real-world data and 10-K filings from public SaaS companies.
We complement this research with a calculator which you can use to benchmark your own spending.
If you’re spending 20–25% of ARR on cloud infra and you’re sub-$10M ARR, you’re not alone, but you must have a path to efficiency.
By the time you’re at $50M+, you will be expected to be under 10% of ARR, or have a clear explanation why not.
Gross margin isn’t just a finance metric, it’s a reflection of how smart your tech and infrastructure ops are. Use this benchmark to calibrate your spend and make informed